Wednesday, December 18, 2013

Old School techniques to hide from modern-day timelines

In the past several years, there have been countless articles about timestamp altering tools and how to detect the usage of these tools. Here are some previous posts here and here.

This post is really about knowing the limitations of your tools and the assumptions you may have about them. This post is not meant to point out good or bad in any specific tools, but to highlight the need to test and fully understand what is happening with the tools you favor so you do not make a critical assumption that haunts you later.

Many examiners today rely on timelines & super timelines to get an overall view of what is happening on affected hosts. With that in mind, lets walk through a simple scenario.

Lets imagine we have imaged a hard drive and are ready to begin our analysis. Some may load the image into their favorite forensic analysis platform and at some point sort the objects by one of four timestamps associated with an NTFS volume. Over the years, many have begun to recognize the value of looking at the (4) four additional timestamps that many forensic tools don't show you, the ones in the filename attribute.  Rob Lee even did a great flow chart to see the various actions that would trigger each of the (8) eight timestamps.

Alternatively, many have opted for using timeline building tools such as log2timeline, analyzeMFT, mft2csv, etc.. etc.. to extract information from each volume's MFT (and other sources) and then display them in an overall 'view' of activity.

Lets walk through a quick example to highlight the main point of this post.

For brevity and to remove a lot of unnecessary 'noise', I will use a simple NTFS volume in this example. So simple that it only has one MFT record in addition to the default records that are created on a newly formatted volume. Here is a view of the volume in windows explorer with the single file.


At some point, I may decide to create a timeline of this volume so I can see all of the files/folders and other time-based artifacts using a tool of my choice:


And output from another tool with all (8) eight timestamps (internal NTFS records omitted from view, but nothing else):


Looks good so far.

So, I sort all the records (in this example case there are just a few) and I don't find anything with timestamps during a time period related with the incident or investigation. Hmmm... I guess I need to look elsewhere.

What I don't know is that the attacker has used an old school trick to hide his tool and its not being displayed in my timeline.

Alternate Data Streams

Alternate Data Streams (ADS) have been a feature of NTFS since it was first introduced in Windows 2000. They are most commonly used by the operating system itself, but otherwise they are not used much from a user perspective. In fact, the Windows GUI does not even let you see these streams without third party tools.

An alternate data stream is nothing more than an additional stream of data in a single MFT record (normally, a MFT record is one entry/record for each file/folder on the volume, but in this case it is one record to many files).

An MFT record can have infinite number  (confined by the limitations of a single MFT record) of streams. This means a single MFT record can have multiple files associated with it. The initial file is the controlling file and the one that creates the MFT record initially. It also is the file responsible for populating the $Standard information and $Filename attributes with the associated metadata. Delete the initial file and all the streams go away as well. Copy the file from an NTFS volume to another NTFS volume and the alternate data stream(s) also go with it.

Earlier I said every file/folder on an NTFS volume has (8) eight time stamps, but that's not entirely accurate.

Data in an alternate data stream is a called "named stream" and it is stored entirely within the $Data attribute of an MFT record, therefore it does not have its own $Standard Information attribute or $Filename attribute. The alternate data stream piggybacks on the controlling (initial) file's SIA and FN Attributes. Therefore, any file in an ADS has no timestamps associated with the stream data itself.

What does this mean?

Well, if I put my malicious tool (putty in this example) into an ADS:


None of its original timestamps are 'transferred' or recorded in the new stream. Depending on the tool you use to create a timeline, that malicious file may not even be found/listed (as shown in the two previous examples), therefore it won't even show up in a sorted timeline.

Here are the original timestamps on the file I placed into the alternate data stream:


Notice those dates are not shown in either of the example timeline data above.

As an attacker, if I pick an existing file that has an old creation timestamp, then put my file into an ADS behind that file, I will trigger the entry modified timestamp for the original file, but that MFT record will still report the old created date, even though I just stuffed a brand new malicious file into an ADS. I don't even ever have to remove that file out of the ADS to run it. I can invoke it directly as it sits inside the ADS. How often do we pay close attention to a triggered record modified date? Is that field included in your timelines?

Would you see this 'hidden' file (alternate data stream) in a tool such as FTK, EnCase or X-ways? Absolutely, but if you sort the files by a timestamp (MACE), depending on how the tool itself deals with these additional streams, these alternate data streams go to the top (or bottom depending on sort order) since they don't have a timestamp associated with it. So, unless you are specifically looking for alternate data streams, they are easy to miss and will not appear in your chronological timeline.


This is an old school trick that does not require any special tools or programs (timestomp, setMACE), but yet it seems to work pretty well against modern analysis techniques.

Download Example MFT
Download E01 image file

Monday, December 16, 2013

EnCase EnScript to parse Recent FileCache.bcf for Windows 7/2008

Corey Harrell recently posted an excellent and very in-depth article about the "RecentFileCache.bcf" file and its value. Yogesh Khatri also posted part one and part two about the "Amcache.hve" file in Windows 8 and an associated EnScript that parses the Amcache.hve.

The EnScript below quickly parses selected "RecentFilecache.bcf" file(s). It also has an option to automatically bookmark any files referenced in the "RecentFileCache.bcf" file.


Sunday, December 8, 2013

EnCase EnScript to show users in each security group

The included in EnCase Case Processor (v6) & Process Evidence (v7) EnScripts do an adequate job of enumerating all the users and listing their security group memberships, but the layout of the data is not very 'friendly' in that it requires you to look through the report and review each user and then keep a mental tally of what users are in which groups as you review the results. There is no summary listing all the groups and who is a member of each.

I wanted a quick way to see the local security groups (SAM) and the users within each group, rather than the other way around (the manner Case Processor & Process Evidence uses).

This EnScript is designed to process the blue-checked SAM file (regardless of path) and then provide a summary in the Console tab that is tab-delimited and can easily be copy & pasted to Excel (if needed) maintaining the fields.


Download here (EnCase v6)

Sunday, October 20, 2013

What 'tier 2' & 'tier 3' tools do you load on your forensic workstation(s)?


I generally categorize software that I load onto my forensic workstation(s) into three classifications or tiers:

Tier 1 - Primary Forensic Analysis Software
    • EnCase, X-Ways, FTK, Forensic Explorer, iLook, etc.
Tier 2 - Forensic Software that supports the primary analysis tool
    • Internet Evidence Finder, RegRipper, Hex editor, etc.
Tier 3 - Software that is not necessarily designed for forensic examination use, but it provides value to my examination.

    • Office Products (Word), Packet capture/analysis tools, screen capturing software, etc.

There is no shortage of opinion and assertions of which primary forensic analysis tool (tier 1) might be the best for the job, just check out any forensic listserv or message forum. But this post isn't about those tools.

This post is really about the often unmentioned supporting tools that make my life easier as an examiner. They are the tools that I rely upon during almost every examination to help process or view the data from whatever primary analysis tool (FTK, EnCase X-Ways, etc) that I may be using.

There are literally hundreds of tier 2 & 3 tools out there, but my intent was to list those that are relied upon in almost every case. Please feel free to comment or add your own in the comment section, I am sure everyone reading will benefit by hearing about a tool that you may use and why. Here are some of mine, in no particular order.

Tier 2

  1. Internet Evidence Finder (IEF) - Deep Internet artifact searching/reporting
  2. 010 Hex Editor - Great hex editor with structure templates and scripting language
  3. SIFT Workstation - SANS virtual machine with lots of tools
  4. FTK Imager - General purpose imaging and viewing utility
  5. Event Log Explorer - Windows event log viewer
  6. RegViewer - Windows registry viewer
  7. Liveview - Forensic virtualization

Tier 3
  1. Hypersnap - Great screen capture software
  2. Microsoft Office - Report writing
  3. Notepad++ - Great simple text editor with source code highlighting and other powerful features
  4. VMware - Virtualization Software
  5. Wireshark  - Packet analysis software
  6. ActiveState Perl - I tend to write lots of little utilities for specific processing/analysis purposes
  7. Cygwin - *nix environment on Windows and lots of useful parsing tools
  8. Splunk - Log aggregation, searching and reporting tool
  9. WinRar - Archive utility that handles ZIP, RAR, 7z, TAR & GZ
  10. Irfanview - Image viewer
  11. VLC - Video player
  12. FFplay - Video player
  13. Plist Editor - Plist viewer
  14. Hashcalc - Hash calculator that supports several different algorithms
  15. LogParser - Log parsing utility
  16. SQLite Expert - SQLite DB viewer
I will mention two additional pieces of software that are not necessarily used during the forensic examination process, but that I reply upon heavily:


Both of these are information managers or journals (one is cloud based, the other is not). I use them to record information about a process, file structures or take screenshots once I learn a specific procedure or I want to record something so I can understand it a year from now after I may have forgotten all the offsets or structure I may have just learned.

Sunday, October 13, 2013

EnCase EnScript to check files against www.virustotal.com and Bookmark with score

This EnScript submits the hash value of files tagged with the 'VirusTotal' label to Virus Total to see if it is known as malware.

Virus Total provides a free public API here. To use their API, you just sign up for their "community" and you get an API key that allows (4) four requests per minute. If you submit more than four files per minute, the EnScript will go into a wait loop and then resubmit once the one minute limit has expired

This EnScript provides a quick automated way to tag files and then the EnScript will grab their hash values and submit them automatically to Virus Total using your API key. This EnScript comes with a DLL files and an EXE that act as the bridge for the EnScript to submit the hash value to Virus Total.

Once downloaded, just unzip the archive and run the included EnScript (EnPack). The initial screen will ask for your Virus Total API key and the path to the 'VT_Bookmark.exe' file included in the archive.


The EnScript will generate the needed hash value for any file(s) tagged with the 'VirusTotal' tag. It will then send the hash file to Virus Total to see if that hash value is known. If the file with that hash value was previously analyzed, then the VT score is obtained and noted in the bookmark. A zero score would signify that none of the AV engines identified it as malware/dangerous, while any other positive number would signify the number of AV engines that identified it as bad.


The EnScript does not send or transmit any data from within the file(s) you have tagged, it only sends the hash value. Therefore, if the score comes back as zero, that does not necessarily mean the file is safe. It just means that the file with that hash value has never been previously analyzed or it was analyzed before and it is just not detected as malware/dangerous.

The intended use of this EnScript is to identify hash values that have a POSITIVE score to draw attention to those files that should be immediately looked at further  rather than disregarding those that come back with a zero score.


Download Here (EnCase v7)
Download Here (EnCase v6)

Wednesday, October 9, 2013

EnCase EnScript for USB info on Win7/8

I have had several people ask me about an updated EnScript to parse connected USB information from Windows7/8 machines.

I actually updated the original EnScript a long time ago, but never posted a blog entry about it. You can find the updated versions here:

Parse connected USB info for Windows 7/8 (EnCase v6)
Parse setupapidev.log for USB info(EnCase v7)

The latter one is also posted in App Central.

Tuesday, September 24, 2013

EnCase EnScript to generate eDonkey ED2K hash values

I recently had a request for an EnScript to help generate some ED2K hash values for the purpose of comparing them to some known bad files based on those ED2K hash values.

ED2K (eDonkey 2000) hash values are documented here and are essentially MD4 hash values. If the file is larger than 9,728,000 bytes, then it is a MD4 of a hash list, with each chunk being hashed with MD4, then all the hash values of all the chunks are concatenated and then a hash is generated from that concatenated string.

This EnScript will generate the ED2K hash values for all files that are tagged with the "ED2K" label OR if no files are tagged with that label, the EnScript will hash all the file, excluding unallocated clusters and any internal file system files ($MFT, $Logfile, etc).

When run, then EnScript will display a brief information page explaining the two options (tagging or all files). This EnScript also has an auto update check function that check this blog for the latest version and it will notify you if there is a new release. If you do not have an Internet connection, the auto-check will timeout and the EnScript will function normally.

All the ED2K hash values are written to the console with two fields; ED2k hash value [tab] Full Path. You can then copy this data into whatever format you wish (Excel).

Since EnCase does not expose an MD4 hashing method to EnScript, this EnScript replies upon a DLL that I wrote that contains the ED2K hashing routine/logic (included in the zip). Simply unzip the archive file and place the EnScript (EnPack) and the DLL in the EnScript folder and then you can run from within EnCase:


Results are in the Console Tab:


Download here (EnCase v7)

Friday, May 17, 2013

EnCase EnScript to automate Internet Evidence Finder (IEF) for EnCase v6 & v7


In an effort to try and make the workflow easier for examiners, I have developed an Internet Evidence Finder EnScript for use with EnCase® v6 & v7. The goal of this EnScript is to make it easier for the examiner to launch an artifact search from within EnCase while they may be analyzing their case. IEF will run in the background and provide a familiar search status screen while it is searching and the examiner can continue working on their case in EnCase.
Once completed, the artifacts will be held in an IEF case file, just like if you had launched IEF the traditional way. In addition, once IEF has completed the search for artifacts, the EnScript provides the ability to copy the found artifact information back into EnCase as record data or into an Excel spreadsheet for additional review.
To install, simply copy the “Internet Evidence Finder.EnPack” to the appropriate folder, depending on the version of EnCase you are using. For EnCase v6 the typical location is:
C:\Program Files\EnCase6\EnScript\
or
C:\Program Files (x86)\EnCase6\EnScript\
For EnCase v7, the location typically is:
C:\Program Files\EnCase7\EnScript\
or
C:\Program Files (x86)\EnCase7\EnScript\
To run in EnCase v7, Choose “EnScript->Run” from to top menu bar, then select the EnScript (EnPack) you just copied into that folder.
For EnCase v6, double-click on the “Internet Evidence Finder” EnScript listed in the filter pane (lower-right).
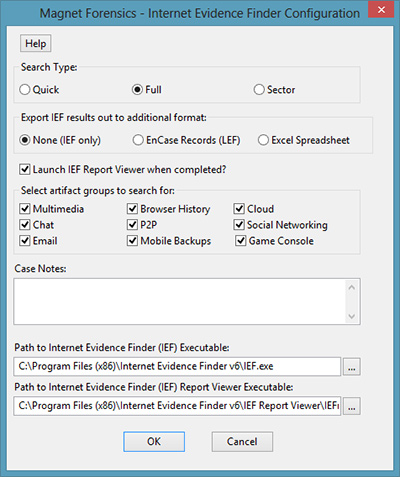
Once the EnScript is run, you will be presented with the following dialog:
Enscript Main Dialog
The first option equates to the “Search Type” option in IEF and defaults to “Full”. In the EnCase v7 EnScript, you are presented with three export options; None, EnCase Records or Excel Spreadsheet. These options do not exist in the EnCase v6 EnScript. “None” means the data found by IEF will be stored inside an IEF case file and can always be viewed by using IEF. The “EnCase Records” option means a copy of the found data will be exported from IEF and placed inside the EnCase Records tab for the current case. The last option of “Excel Spreadsheet” means a copy of the found data will be exported from IEF and placed inside an Excel Spreadsheet with each artifact type getting its own worksheet. The IEF case file and data are created and stored in the case’s default export folder.
The next option determines if you want the EnScript to automatically launch the IEF viewer and load the found artifacts so you can immediately review them in IEF.
The fourth option determines the types of artifacts you want IEF to search for.
Any text in the case notes is automatically transferred to IEF and entered into the IEF Case file. In addition, the examiner name and evidence number (EnCase v7) are automatically pulled from the EnCase case information when the case was initially created.
The final two options specify where the IEF.EXE and IEFRV.EXE files are. These two files are needed in order to launch IEF in the background and later load the case data, if selected. Once initially entered, this information remains each time you run the EnScript.
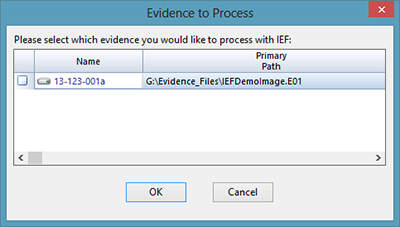
Once you click “OK”, you are presented with an evidence list where you can select which pieces of evidence you would like to process.
Evidence to process
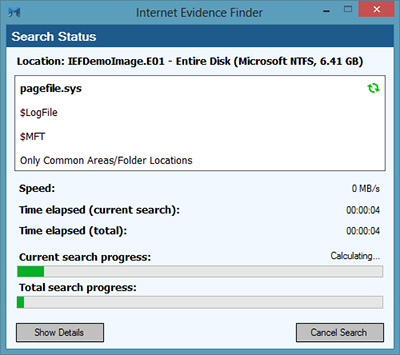
Once run, IEF will launch in the background and process all the evidence files you selected. An IEF status screen will be displayed:
Search Status
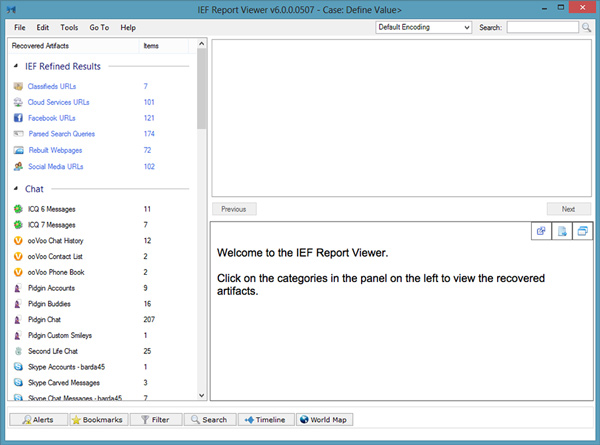
If you selected the option to have IEF Report Viewer launch, the case will be automatically loaded and displayed in the report viewed once complete.
Report Viewer
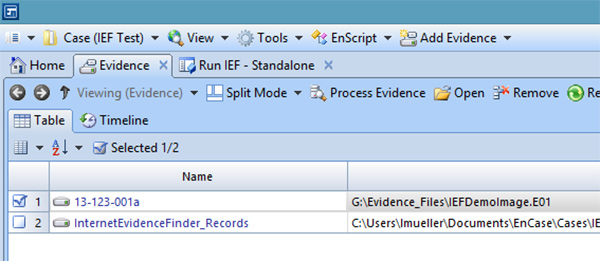
If you chose the export option to have the data exported into EnCase Records, you will see this from the Evidence pane in EnCase v7:
Report Viewer
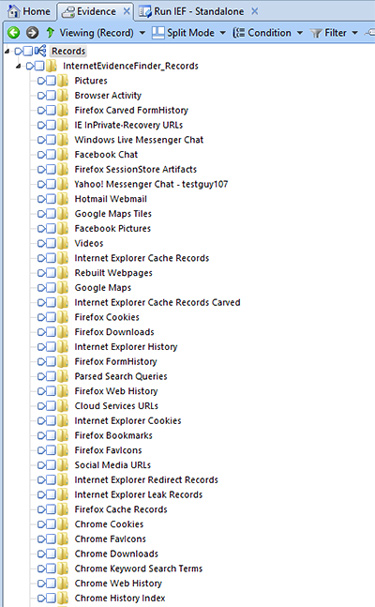
Clicking on that LEF will load the records in the records tab of EnCase:
Records Loaded
You can then view the found IEF artifact data the same way as you view other data stored in the EnCase Records structure and build custom filters/conditions to identify specific artifacts. You can always view the IEF data natively in IEF Report Viewer by double-clicking the IEFv6 case file stored in the default export folder of the case.
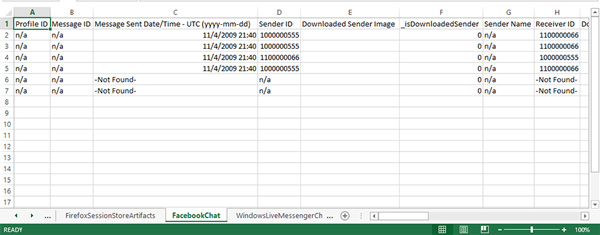
If you chose the “Excel Spreadsheet” export option, Excel (required) will automatically start and display the artifacts with each category of artifact on a separate worksheet. By default the XLS file is automatically saved in the default export folder of the case along with the IEF case file and other associated data.
Excel Spreadsheet

As always, if you have any comments, suggestions or questions,
you can contact me directly at: lance (at) magnetforensics.com


Thursday, April 25, 2013

EnCase EnScript to send data directly to SPLUNK for IR, Investigations & Timelines

This EnScript was original designed to aid in the triage and processing of multiple hosts by multiple examiners while conducting Incident Response & Investigations and quickly collate all the data together. This can also be used to create simple timelines.

Imagine you work for a medium to large company and you have an incident that requires some immediate triage. "Triage" in this sense means that responders are going to need to connect, examine and evaluate several hosts to determine what is going on or what has happened. During this triage, it is likely that the examiner(s) are going to come across files/folders of interest that may need to be remembered, compared to other files found on other hosts and/or documented later.

This EnScript was designed to allow the examiner to simply "tag" those files/folders and send the data directly to Splunk. To make this simple, you can easily setup your own IR/Investigative instance of Splunk that can digest up to 500MB of data daily, for free. The idea is to let each examiner dig through images/drives and quickly tag things of interest. All the data is sent to Splunk so it can easily be overlaid on top of other data and shown in relation to other hosts. This allows analysts to query and build real-time reports in Splunk while the triage is still happening.

To make this illustration as simple as possible and assuming you don't already have an instance of Splunk up and running , I downloaded the SANS SIFT virtual workstation and downloaded the Debian Splunk installer package from this link. Once downloaded, simply double-clicked on the package in the Nautilus GUI to install it. Once installed, you will need to start the Splunk service as root (sudo splunk start).

Once started, you will need to tell Splunk via the "Manager" link on the top-right that you will be sending it data over a TCP port from EnCase. To do this, you define a TCP data input and select a TCP port that you want Splunk to listen on to accept this data.


In this example, I defined a TCP port in Splunk to listen on port 9100 and provided a source name override of "EnCase". The source type is "CSV".

Next, you will need to explain to Splunk the type of data you will be sending it and how its formatted. To do this, you can create two files in the /opt/splunk/etc/system/local folder (assuming to installed Splunk in the default location) named props.conf & transforms.conf.

props.conf:
[source::EnCase]
MAX_DAYS_AGO = 10000
TZ =  America/Los_Angeles
REPORT-EnCase = EnCase_Format
TIME_PREFIX = Timestamp..

transforms.conf:
[EnCase_Format]
DELIMS="|"
FIELDS="Timestamp","Type","CaseName","Filename","Path","Extension","LogicalSize","INode","MD5","ExamHostname","Examiner", "Notes"

(note: each field should be defined and reside on its own separate line. The above data may appear wrapped depending on your browser).

The first file (props.conf) defines a stanza for a source named "EnCase" (which we provided as a source override when we setup the TCP data input in the Splunk GUI). The MAX_DAYS_AGO is important because if you encounter files with old timestamps, they may be skipped and not recorded unless you tell Splunk that you will be sending it data with old timestamps (very important if timestomping is suspected). The "TZ" field defines what time zone the data is adjusted for. The "REPORT" field refers to the Stanza we will define in the transforms.conf file. The last field defines a REGEX that tells Splunk what to look for immediately preceding the timestamp that it will use as the timestamp reference to affirmatively grab the correct timestamp.

The second file (transforms.conf) defines the delimiter and the fields used by the EnScript as the data is sent to the TCP socket.

Once setup, just ensure the SIFT virtual machine (now with a Splunk server installed) is reachable via the network by all EnCase examination machines that will be sending data to it. By default the SIFT virtual machine is setup to use NAT networking on the host machine, which means it will only be reachable by the host machine. Use bridged networking if other machines will be running EnCase and sending it data via the EnScript.

Since in this use case you are not using the Splunk instance as a heavy forwarder or indexer and sending thousands of events to it every second, I have not found any performance issues running it in a virtual environment as described above. If you were running the Splunk instance and sending data to it from hundreds of hosts or forwarders, then you would probably want to have a non-virtual dedicated instance with some optimized networking.

In EnCase, create a tag named "SendToSplunk". Tag any files you come across that are of interest and you want to send to Splunk.


Once you have tagged all the files of interest, run the EnScript and you are presented with the following dialog:


The examiner's name is automatically pulled from the "Examiner Name" data value in the case, if set:

 
The examiner's hostname is also automatically pulled from the local machine running EnCase. This is for tracking purposes once the data is sent to Spunk so you can validate and link the data back to the examiner's machine that sent it.

Set the Splunk server IP to the IP address of the SIFT workstation or wherever your Splunk instance is installed and the port you defined in Splunk when you setup the TCP data input (9100 in the example above).

Once run, the data will appear in Splunk with the fields already extracted for searching:


Each tagged file is sent to Splunk for each timestamp that is available. This is normally four times if the file is not deleted, five if there is a deleted timestamp. Each time the file metadata is sent to Splunk the timestamp used in that particular record is defined using the "type" field.

Download Here (EnCase v7)
Download Here (EnCase v6)

Thursday, March 28, 2013

Crafting good keywords in EnCase and using conditions to refine results

I was contacted today by an examiner asking about some search hits that contained a very common keyword and how to quickly and easily refine them down to a relevant subset. This is pretty basic EnCase training stuff, but I figured I would put together a quick post that explained some things to think about when crafting keywords and then also the basic mechanics of creating a filter than can help you narrow down your hits. For this article, I am only going to discuss conducting a 'live' keyword search across an image, not using the index feature.

Filters & Conditions are probably one of the most underutilized features in EnCase and they can certainly help with issues like this when you have already run a search and then later realized the keyword was not the best choice. The best way to avoid this is to think ahead and use a good keyword that eliminates a lot of the noise for you and will hopefully leave you with just relevant hits.

Lets first talk about some ideas when crafting your keyword(s) to save you time later. For the purposes of this article, lets assume I want to search for the ANSI keyword "soft". As you can image, this keyword is likely to return thousands and thousands of search hits that are not relevant and create a lot of noise that I would have to filter through to get to the good stuff.

Admittedly, most people could predict that a keyword of 'soft' would result in a lot of hits (software, Microsoft, etc). But sometimes its not that apparent until after you start the search and later realize that your unique keyword is not so unique after all. This is where we will leverage a condition to help, but lets get back to choosing a good keyword.

Int he past, I have seen a lot of examiners create a keyword such as " soft ". Yes, that's a space in front and a space after the keyword itself. While this may work for a small percentage of the hits, this will most definitely miss things you would probably want to see. I do not recommend you ever use a keyword like this except in very rare unique cases. While this keyword would certainly exclude hits such as "Microsoft" & "software", you are also going to miss "soft." or "soft" at the beginning of a line.

Using a test image, a search of " soft " (space before and after the keyword) results in 167 search hits being found.


Another approach is to use the "Whole Word" option in EnCase:


Using the same test image, a search using this option resulted in 6,036 search hits.


Using the same test image, a search of 'soft' (disregarding where is may appear in other words or sentences) resulted in 2,894,317 search hits:


Using a GREP statement of '[^a-z]soft[^a-z]' on the same test image resulted in 6,272 search hits:


So what does the GREP search include that the "Whole word" option does not? The GREP expression catches every occurrence of 'soft' when not preceded or proceeded with a alpha character (ASCII dec 65-90 or dec 97-122) . All other characters are acceptable (ASCII dec 0- 64, dec 91-96 & dec 124-254). 

The "Whole Word" option does not catch all the non-alpha characters. It catches the common punctuation characters, but excludes high-ASCII characters. You can see an example here of what the GREP term found, but the "Whole word" option missed:


The other thing to notice is that with the "whole word" option, the preceding proceeding characters are not part of the hit, whereas with the GREP term they are. This changes your total hit size and beginning offset in case you are running some type of script that requires knowing the starting offset of where they keyword hit begins.

As a reminder, in general GREP searches require more time to run than non-GREP keywords. The exception to this is when using the "Whole word" option since this is treated similar to a GREP search where there could be multiple valid characters that precede/proceed the keyword and have to be checked (thus requiring more time).

So what if you have run your keyword search and have lots of false hits and want to start narrowing down the good hits. This is where a condition really comes into play. Remember that in EnCase v6, the filter and condition pane is exclusive to the display tab you are currently viewing (entries, search hits, keywords, etc). The first thing it to switch to the search hits tab. Then select the "conditions" tab in the lower-left pane and right-click choosing "new".


Name your condition, then right-click on "Main" and choose "new":


Once the "term" window appears, choose the "preview" property, then select MATCHES from the operator options and then enter all the common keywords int he value field that are appearing in your results that you want to exclude. In my example, I want to exclude "microsoft", "software", etc. Click on Okay and you are back to the initial condition window that looks like this:


Right-click on the condition and choose "NOT":


The condition should now say "if NOT Preview matches.......":


Click on "Ok" to complete the condition and then double click on it to run it:

Understanding that depending on the number of hits you are trying to filter down, this could take awhile to apply this filter. 

The other downside to this approach is that it is possible the search hit is valid and only consists of 'soft', but a few words before or after your keyword hit is the word 'microsoft'. This filter would hide that search hit since we are asking it to hide anything (if NOT preview matches "microsoft" or "software") where the words 'microsoft' or 'software' are in the preview field (128 bytes before the hit and 128 bytes after the hit, including the hit). The only way to remove hits that contain common words that are not of interest and not risk excluding the hit because they appear elsewhere in the preview field is to use an actual filter (EnScript code) to check each hit and to exclude those where the actual hit text does not match a list of excluded words.

Here is a link to some brief documentation that I wrote regarding writing your own filters.

The underlying message to this article is that picking your keyword(s) from the beginning may be more important than you think and can save you a lot of time later, so try and think them through from the beginning ;)

Wednesday, March 20, 2013

File Entropy explained

I posted a quick EnScript yesterday that calculates the entropy of any selected object in EnCase. One of the comments I received asked for more information about what entropy is and what do the values represent. This post is to provide a little more detail about what entropy is and how it can be helpful/useful.

Entropy is technically defined here and is the second law of thermodynamics.The technical explanation of entropy in computing terms is described here. Simply put, entropy as it relates to digital information is the measurement of randomness in a given set of values (data).

The equation used by Shannon has a resulting value of something between zero (0) and eight (8). The closer the number is to zero, the more orderly or non-random the data is. The closer the data is to the value of eight, the more random or non-uniform the data is. The formula used by Shannon to represent binary data looks like this:

Here is a simple example. Imagine you have a file that is 100 bytes in length and that is filled with the value of zero (0).


Using the above formula, you get a result of  zero, meaning the probability of any other value other than zero appearing is zero. Now consider the same 100 byte file filled with half zeros and half ones:

Using the same formula as above, the result would be one. 

Take this same file and compress it using Rar:


Entropy = 5.0592468625650353

Take the same message (half zeros and half ones) and encrypt it with PGP and you get this:

Entropy = 7.8347915272089166

Encrypt a blank volume in TrueCrypt and you get this:


Entropy = 7.9999997904861599

The closer you get towards truly random data, the closer the entropy value will be to the maximum value of eight, meaning there is no pattern or probability to guess what the next value might be. 

How is this useful:

Entropy can be used is many different way, but quite commonly to detect encryption and compression, since truly random data is not common in typical user data. This is especially true with executables that have purposely been encrypted with a real-time decryption routine. This prevents an AV engine from seeing "inside" the executable as it sits on the disk in order to detect strings or patterns. It is also very helpful in identifying files that have a high-amount of randomness (as illustrated above), which could indicate an encrypted container/volume that may go otherwise unnoticed.

In the original post, there was some discussion on a forensic message board about using entropy to detect the use of a wiping tool against unallocated space. In that example, you would be looking for repeating patterns that occur over a large area of unallocated. Again, the higher the entropy value, the more random the data, vs. the smaller value which indicates more uniformity of the data.

Reference: "File Entropy", McCreight, Shawn

Tuesday, March 19, 2013

EnCase EnScript to calculate entropy of selected file(s)

I saw a recent post on one of the forensic mailing lists about calculating the entropy of unallocated space to determine the "randomness" of the data to help determine if a wiping utility had been used.

I had written this quick little EnScript awhile back to calculate the entropy of any selected file, but since EnCase treats Unallocated Clusters the same as a file (an object within EnCase), its works just fine on calculating the entropy of Unallocated space.

Simple select (blue check) the files you want to calculate and run the EnScript. Each file and the entropy value will be written to the console tab.


Download here (EnCase v6)

Tuesday, March 5, 2013

EnScript to parse setupapi.dev.log

This EnCase EnScript was written to parse the Vista/7 'setupapi.dev.log' for USB events. This log contains a lot of information about hardware events, including when USB devices are attached.

 
This EnScript extracts and displays relevant USB events:


Download here (EnCase v6)

Wednesday, February 20, 2013

EnCase EnScript - Categorize files by specified file extensions, bookmark and provide count

This EnScript was a request related to the original EnScript written here.

This EnScript will provide a ConditionClass dialog where you can specify whatever file extensions you want to look for and categorize.


Once run, it will search for all the files with the extensions you specified and provide a brief tab-delimited summary to the console window. It will also bookmark all the files that match any of the specified extensions.


Computer Forensics, Malware Analysis & Digital Investigations

Random Articles